Basketball Odds React to Injury Reports and Shifts in Team Dynamics
Written by Erik Keller · Oct 28, 2026
Basketball Odds React to Injury Reports and Shifts in Team Dynamics
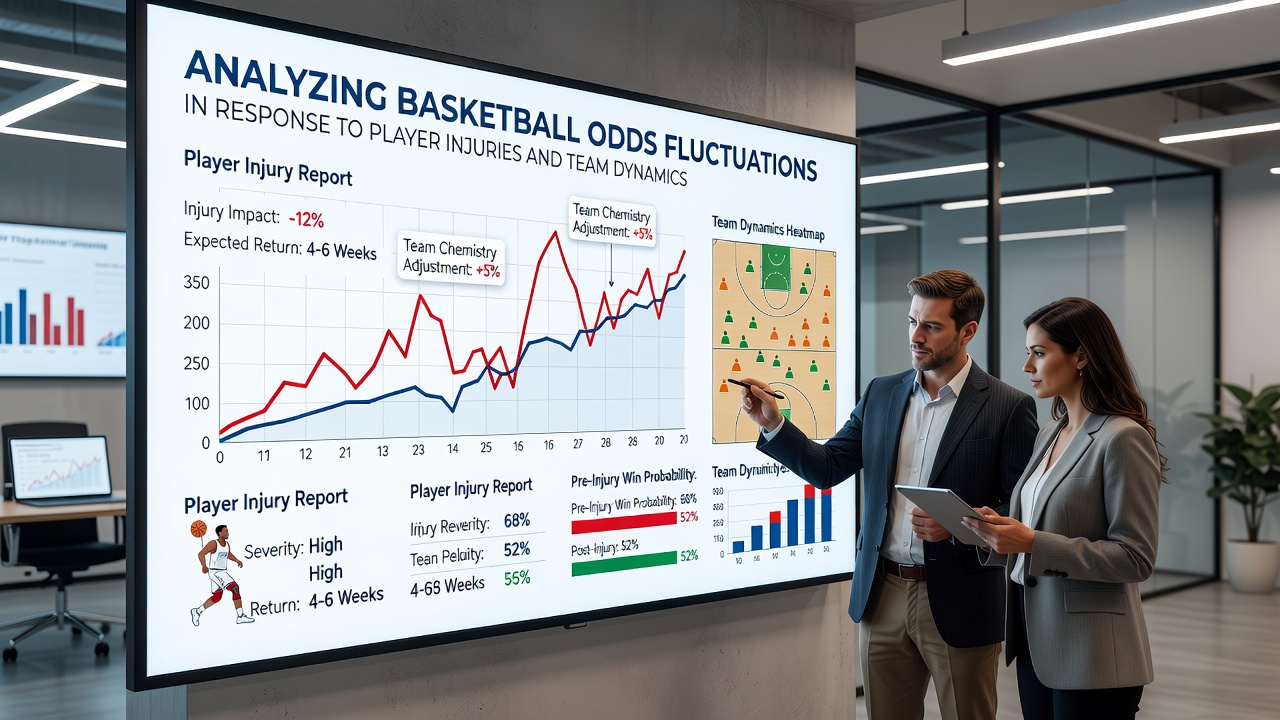
Data from major sportsbooks indicates that basketball odds adjust rapidly once official injury reports reach the public, with point spreads moving between two and six points on average when a starting player sits out, while moneyline figures shift even more dramatically in high-profile matchups. Observers note that these changes occur because oddsmakers recalculate expected team performance based on historical player contribution metrics, minutes played, and efficiency ratings pulled from league databases.
How Injury Announcements Drive Line Movement
Bookmakers monitor pre-game injury disclosures closely, and analysts track the timing of those releases because early notifications allow markets to stabilize while late scratches create sharper volatility. Research from the Nevada Gaming Control Board shows that star player absences correlate with a 12 to 18 percent increase in betting handle on the opposing side, prompting sportsbooks to widen the spread or adjust totals downward when offensive production is projected to decline. One study revealed that teams missing their primary scorer see field goal percentage drop by roughly four points on average, a figure that directly feeds into revised over-under calculations.
Team medical staff submit reports through league channels, and those updates reach betting platforms within minutes, yet the speed of public reaction varies by market depth. In October 2026, during the opening weeks of the new season, several high-profile cases demonstrated this pattern when multiple rotation players were ruled out simultaneously, causing totals to fall by seven to nine points in affected games before stabilizing the following day.
Team Dynamics and Their Influence on Performance Projections
Beyond individual absences, collective team dynamics shape how oddsmakers set and revise lines because chemistry metrics, backcourt pairings, and defensive rotations alter expected outcomes. Data indicates that squads with strong bench cohesion maintain closer margins even after key injuries, whereas teams reliant on single-star systems experience steeper declines in efficiency ratings. Figures from the Sport Analytics Institute at the University of Michigan illustrate that lineups featuring three or more players with over 1,000 minutes of shared court time post fewer turnovers and allow lower opponent shooting percentages.
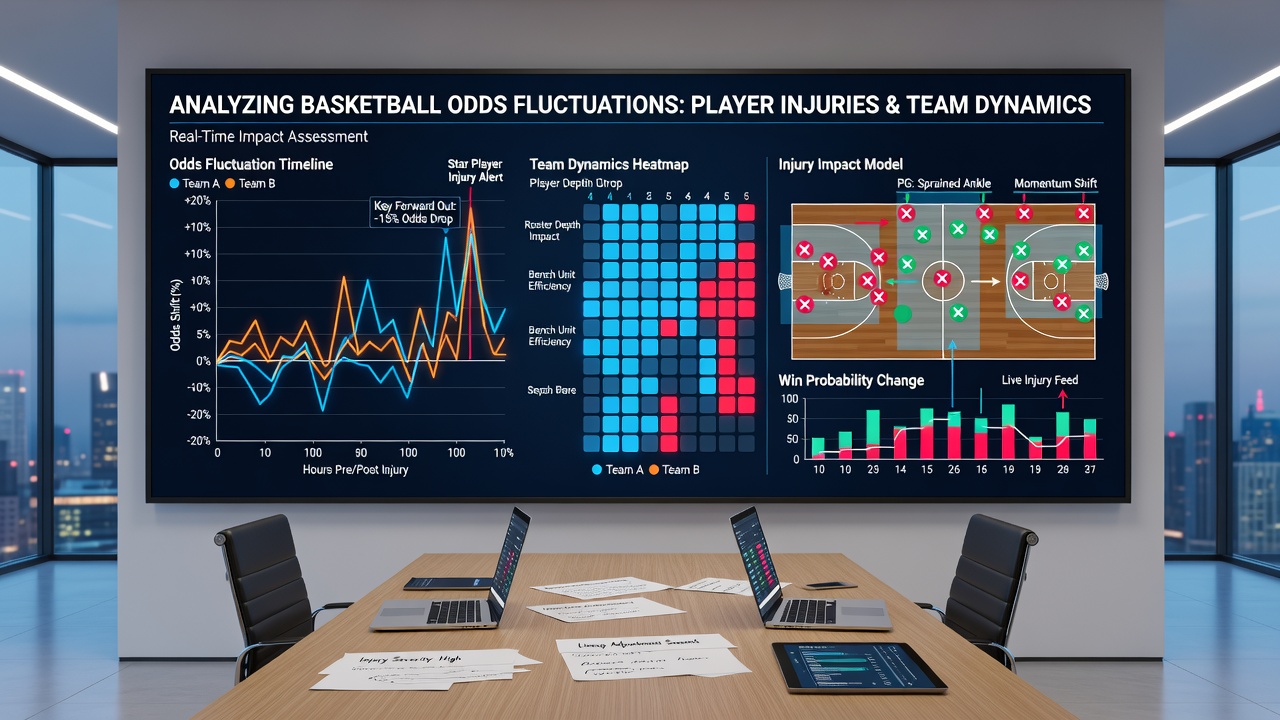
Coaching adjustments further complicate these calculations because mid-game substitutions and tactical shifts can offset missing production in ways that static models fail to capture. Analysts examine usage rate changes, assist-to-turnover ratios, and defensive coverage assignments when projecting revised point differentials. Evidence suggests that teams with flexible defensive schemes limit the damage from forward injuries more effectively than those locked into rigid zone or man-to-man systems.
Historical Patterns and Market Responses
Long-term tracking of injury-related odds movement reveals consistent seasonal patterns, particularly around playoff time when roster depth becomes critical. Records compiled by the Canadian Centre for Gaming Research show that injury clusters in March and April produce the largest line swings, with totals moving eight or more points when multiple rotation players are unavailable. Bettors who follow these trends often wait for the second wave of adjustments after initial sharp action settles.
Weather, travel schedules, and back-to-back games compound these effects because fatigue interacts with missing personnel to alter both offensive and defensive outputs. Markets respond by layering additional adjustments onto base injury models, creating layered line changes that reflect multiple variables simultaneously. What's interesting is how quickly sportsbooks integrate real-time data feeds from league sources to recalibrate totals and spreads before tip-off.
Conclusion
Odds fluctuations tied to player injuries and team dynamics follow measurable patterns rooted in performance data, historical trends, and rapid market recalibration. Regulatory bodies and research institutions continue to document these movements across different leagues and seasons, providing clearer insight into how information flows from medical reports to final betting lines. Those who study these interactions gain a structured view of how roster changes translate into numerical shifts on the board.